Results & progress.
See how your biology changes over time. EVA™ tracks biomarker trends, biological age, and protocol impact so progress is something you can actually see.
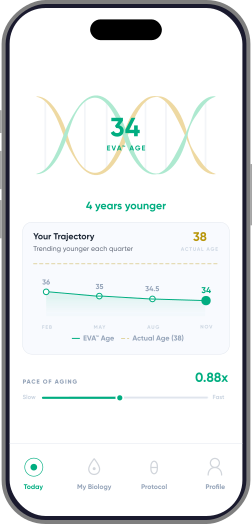
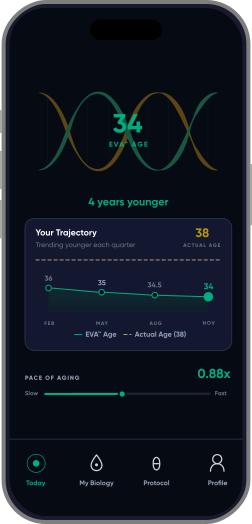
How EVA™ measures progress.
Progress is not a number. It is a direction. EVA™ tracks what matters: biomarker trends, biological age, and protocol impact.

How to read an EVA progress example
A progress example can show what was recorded between two assessments. It cannot establish that the programme caused every change or predict what another person will experience.
The example
EVA's case study follows T.P., a 35-year-old man, from January to October 2026: nine months and three blood panels, with a focus on inflammation, metabolic health, heart health and biological age.
| Measure | First panel, Jan 2026 | Latest panel, Oct 2026 | Change |
|---|---|---|---|
| Biological age (KDM) | 39.6 years | 35.2 years | 4.4 years younger |
| hs-CRP | 2.29 mg/L | 0.66 mg/L | 71% lower |
| HOMA-IR | 2.09 | 0.71 | 66% lower |
| ApoB | 124 mg/dL | 90 mg/dL | 27% lower |
See how the KDM-13 estimate is calculated before comparing two scores.
What changed?
Over nine months, every headline marker moved in the right direction. Inflammation (hs-CRP) fell by about 70%, into the lowest-risk range for heart disease. Insulin resistance (HOMA-IR) fell by two-thirds, a sign that his body was handling blood sugar far more efficiently, which lowers his long-term risk of type 2 diabetes. His biological age moved from about four and a half years above his actual age to roughly in line with it. ApoB fell by more than a quarter but is still above his target, so it remains the main focus of his plan. These changes came from targeted supplementation, with each repeat blood panel used to adjust and improve the plan.
How to read a single case
This is one person's journey, not a controlled trial, so it cannot show exactly how much each part of the plan contributed, or predict your own results. What it does show is the EVA approach in practice: measure, act on what the results show, then measure again to confirm the plan is working and refine it. Results are indicative. Individual outcomes vary.
How should you compare your own assessments?
- Keep the original reports and collection dates.
- Check units, methods and whether the measurements are comparable.
- Record relevant changes between assessments.
- Review individual findings with your clinician.
- Understand the age-estimation method before interpreting the score.
Look beyond the headline number
The most useful discussion is what the results mean for the individual and whether the plan should change. A single age score should not replace that conversation.
Read how biological-age estimates work and prepare for a follow-up review. Ask EVA about the assessment process.
Individual case studies.
Explore measured changes, the context behind each result and what remained in progress. Individual outcomes vary.
T.P.’s case: hs-CRP fell 87% over six months
A substantial change in an inflammation marker, with a clear view of what still needed attention. See the blood results, the personalised plan and the priorities at follow-up.
Read the case study › Case study 02P.F.’s case: LDL fell 26% across three reported panels
Three reviews show when changes happened and why testing conditions matter. Follow the LDL, liver-marker and biological-age results across the full record.
Read the case study › Case study 03D.S.’s case: ApoB fell 31% and homocysteine 59%
The biological-age score is one part of the record. Explore the individual blood-marker changes, the documented plan and the separately labelled account in EVA’s published PDF.
Read the case study › Case study 04N.F.’s case: fasting insulin fell 55% over seven months
Metabolic progress and an ongoing lipid priority appear in the same record. See how repeated blood results can reveal both the changes and the work still to do.
Read the case study › Case study 05P.M.’s case: ApoB fell 35% over twelve months
A year of follow-up makes the trajectory visible. See the lipid and metabolic changes, including the medication context needed to read the results fairly.
Read the case study › Case study 06J.I.’s case: triglycerides fell 40% over five months
Several markers changed while others remained priorities. Read the individual results alongside the KDM-13 score to see the full five-month picture.
Read the case study › Case study 07K.A.R.’s case: HOMA-IR halved during DNA-informed care
Genetic information helped frame an individual plan; blood testing recorded what changed. Explore the metabolic results, both age scores and the priorities that remained.
Read the case study › Case study 08S.H.’s case: ApoB fell 18% at follow-up
Measured lipid changes, an ongoing Lp(a) priority and three differently defined ageing measures. This case keeps the detail visible so each result can be read in context.
Read the case study ›Individual observational cases, not controlled trials. Results vary with baseline health, lifestyle and adherence.
What influences progress?
Consistency
Results follow regular testing and adherence to your protocol.
Lifestyle integration
Your daily choices shape progress. EVA™ guides, it does not dictate.
Time
Biology moves in months, not days. EVA™ is built for the long view.
Real experiences. Real members.
The whole experience has been seamless and effortless from start to finish. I took on the challenge of running across 3 countries in the month of November, and with the help of Elite Vita they made sure I was in the best possible condition before every run. The blood samples and IV's were effortless, Mark did a great job of making sure I was relaxed and the samples were taken easily. Dr Nival offered his expertise along the way and gave me peace of mind throughout.

Evren Ozka
Founder, Mallet London
I've had an outstanding experience with Elite Vita. From day one, the level of professionalism, knowledge, and genuine care has been exceptional. Their guidance has been tailored, strategic, and incredibly motivating. Thanks to their dedication, I've seen real, measurable progress and feel better than I have in years.

Paul Farhi
Founder, Solidus AI Tech
Before starting the program at Elite Vita, I already felt like I was doing a lot of things right with my health, but I still had days where my energy dipped and my focus wasn't always where I wanted it to be. What stood out immediately was how clearly the team explained what was actually happening in my body, and walked me through my biomarkers, genetics, and the specific areas where my system could run into problems over time if left unaddressed. Once I understood those weak points, the plan they designed made a lot of sense. When we repeated the testing, it was really satisfying to see that the improvements I was feeling were also reflected in the numbers.

Daniel Salewski
Founder, EliteVita
Start tracking
what matters.
Join the EVA™ waitlist and be first when the app launches in Dubai.
Reserve your place
No payment now. We'll be in touch with foundation-access details via WhatsApp, SMS, and email.
By joining, you agree to be contacted by Elite Vita about EVA™ early access via email, SMS, and WhatsApp. Your data is stored in the UAE under PDPL.